

Marine BI
Aggregate the Data. Anticipate the Future. Act with Confidence.
Mainstay Marine BI transforms raw maritime data into forward-looking intelligence, surfacing the patterns that matter so you can act faster and smarter.
Unlock Deeper Intelligence. Drive Safer, Smarter Operations.
Marine assurance runs on fast-moving rules and ever-growing data. Marine BI cuts through the noise by pulling live industry feeds and deep historical records into a single engine, then applying advanced analytics to reveal risks.
Turn Data into Foresight
Marine BI applies advanced analytics to live industry feeds and rich historical records, learning from past activity to predict future patterns. By scoring, trending and benchmarking performance, it enables you to turn hindsight into foresight - optimising today’s marine-assurance decisions for safer, more efficient operations.
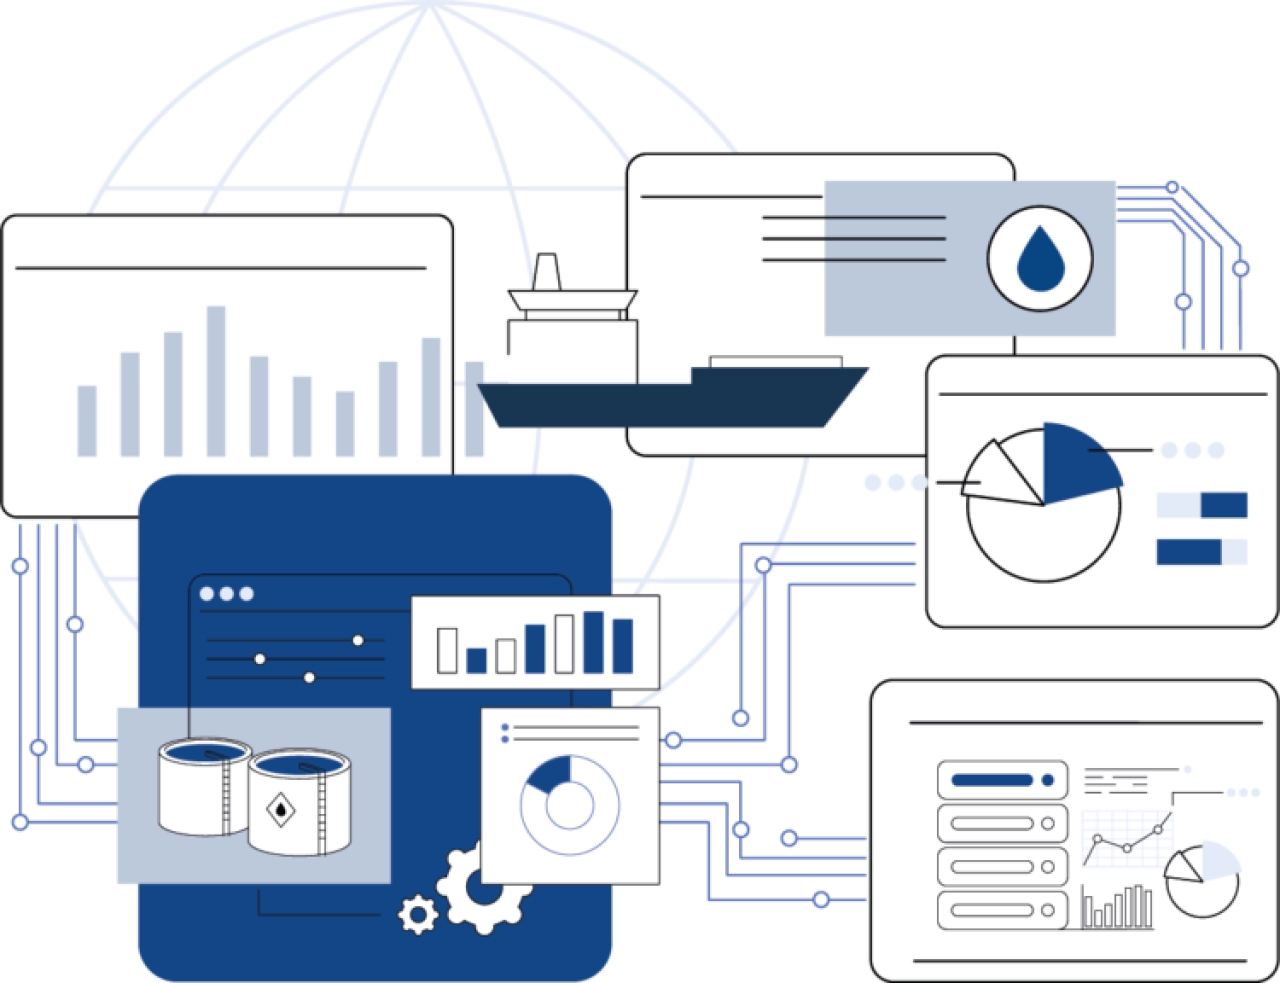
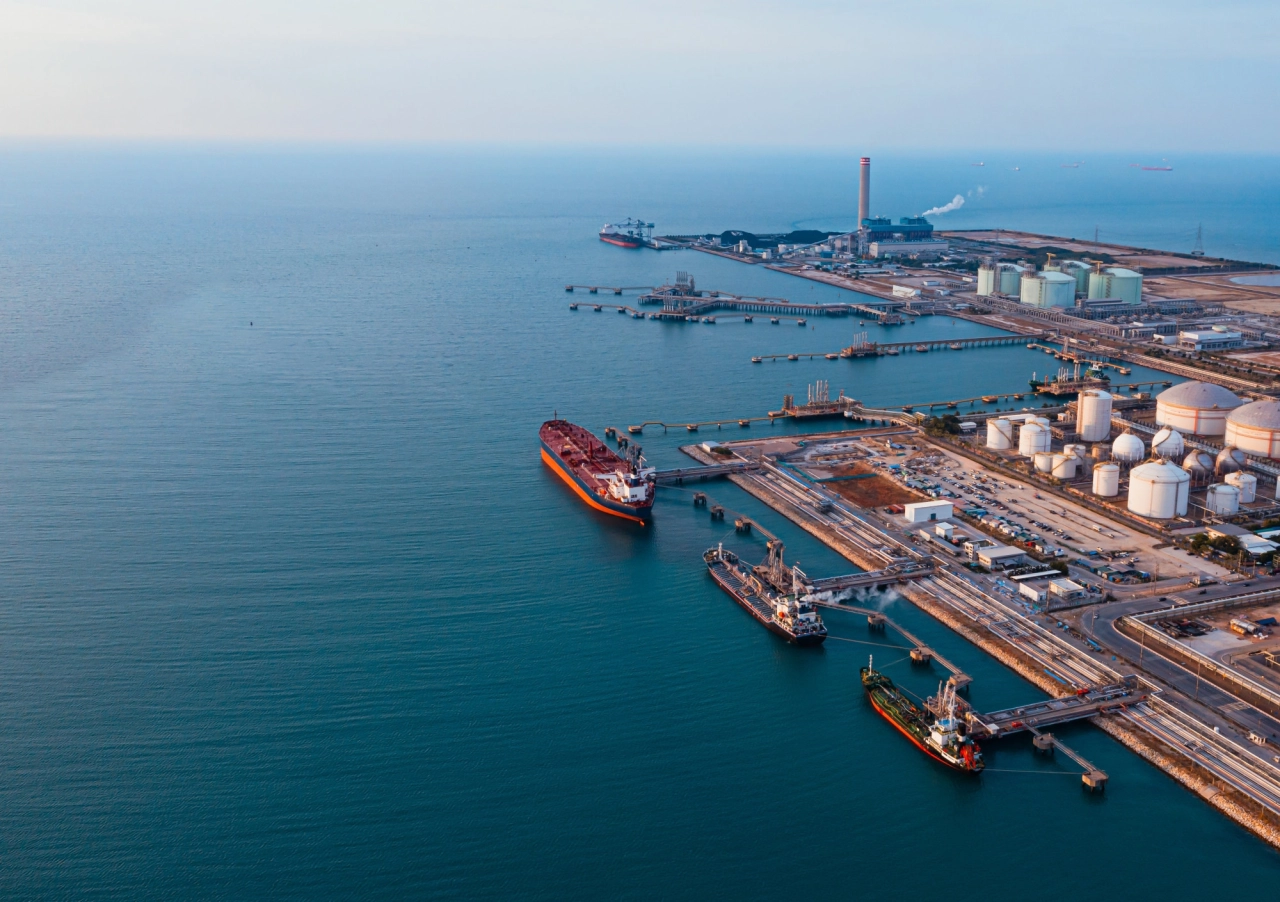
Marine BI adds a strategic layer to your Mainstay platform, transforming day-to-day data into actionable foresight for charterers, operators and risk teams alike.
Joe Anderson
Lead Data Scientist, MIS Marine
Unlock the potential of your data
Marine BI transforms feeds and history into forward-looking intelligence for safer, smarter shipping.
Vetting Analysis
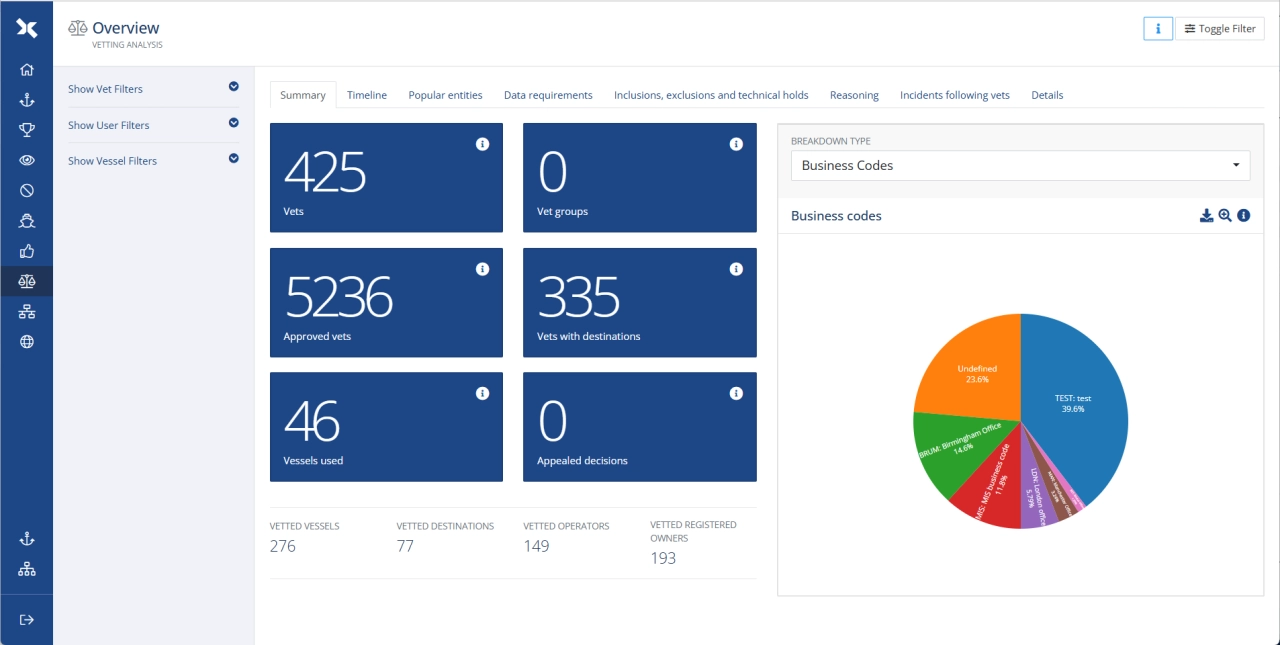
Marine BI’s Vetting Analysis mode shines a light on the effectiveness of your assurance process, combining your internal vetting records with industry intelligence from OCIMF inspections, PSC reports and incident data. The outcome is a clear, dashboard-ready view of where you excel, where decisions slow down and where hidden risks could emerge.
At a glance you can:
Vetting Mix – Instantly visualise the share of each vetting category across your operation.
User Accountability – See exactly which team members own—and action—every vet type.
Decision Anomalies – Detect unusual spikes in approvals or rejections before they skew performance.
Process Gaps – Spot issues that surface after a vet is closed and target fixes fast.
Turnaround Benchmarks – Compare average decision times and pinpoint slow-downs by user, function or operator.
Rejection Drivers – Uncover the most common “no-go” reasons and who’s raising them, for targeted improvement.
Post-Vet Insight
Marine BI’s Vetting Analysis unlocks a complete, after-action view of every vetting decision, turning raw timelines into clear, actionable insights. By capturing the full lifecycle of each vet - from submission to final decision - Marine BI makes it easy to measure performance, refine policies and target improvement efforts where they matter most.
Spotlight on Incidents – Closing the Feedback Loop:
Incident Back-Check – Monitor any incident that occurs within six months of a positive vet and link it to the checks originally applied, so you can see if a decision needs re-evaluation.
Likelihood vs. Reality – Compare each “go” call with the incident probability calculated at the time, revealing how accurately your vetting model anticipated risk.
Process Gap Finder – Pinpoint stages where incidents slipped through after approval, guiding precise workflow improvements.
Performance Indicator Timeline – View a clear, pre-vet timeline of key metrics and signals, making it easy to spot patterns that may have influenced (or should influence) future decisions.
Fleet Analysis
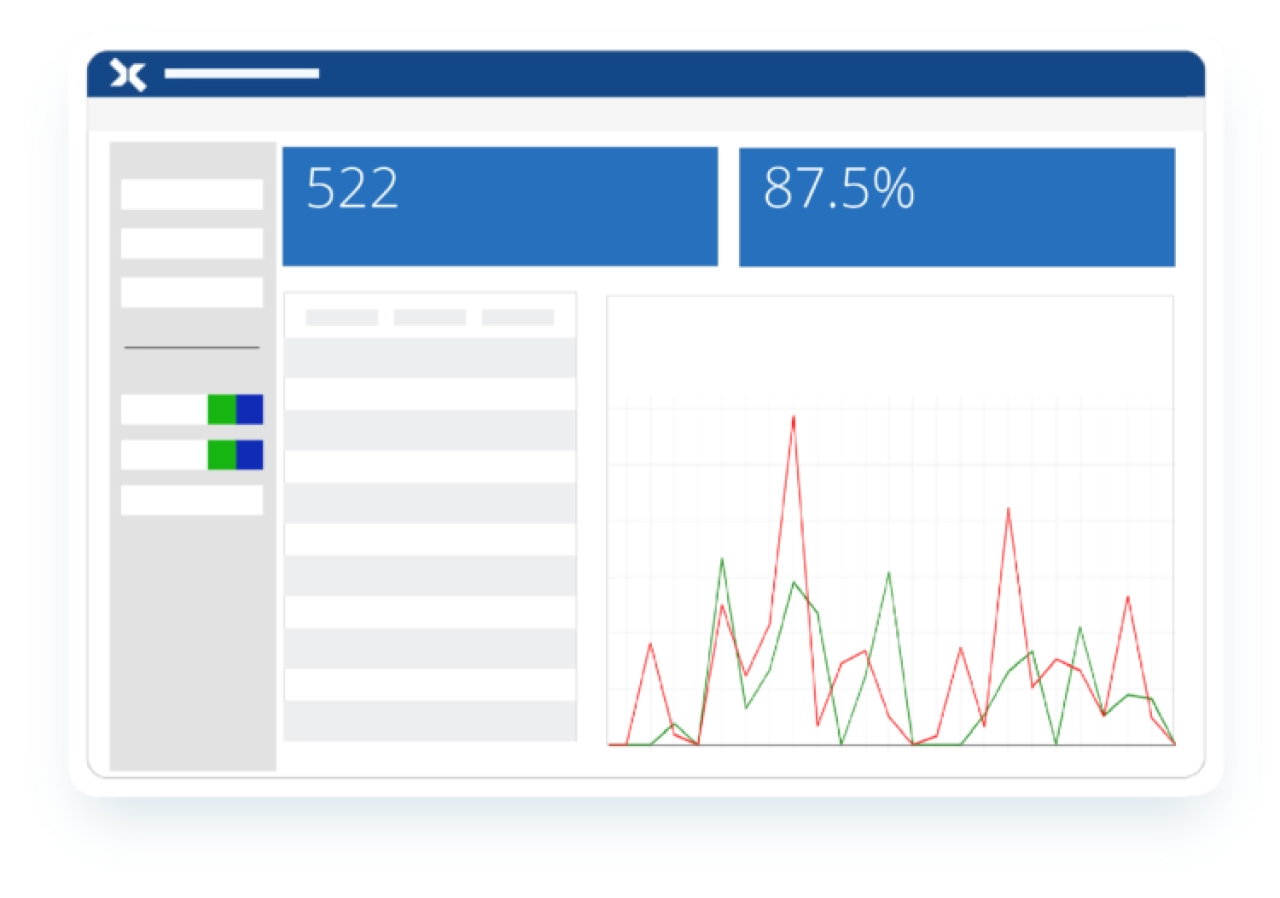
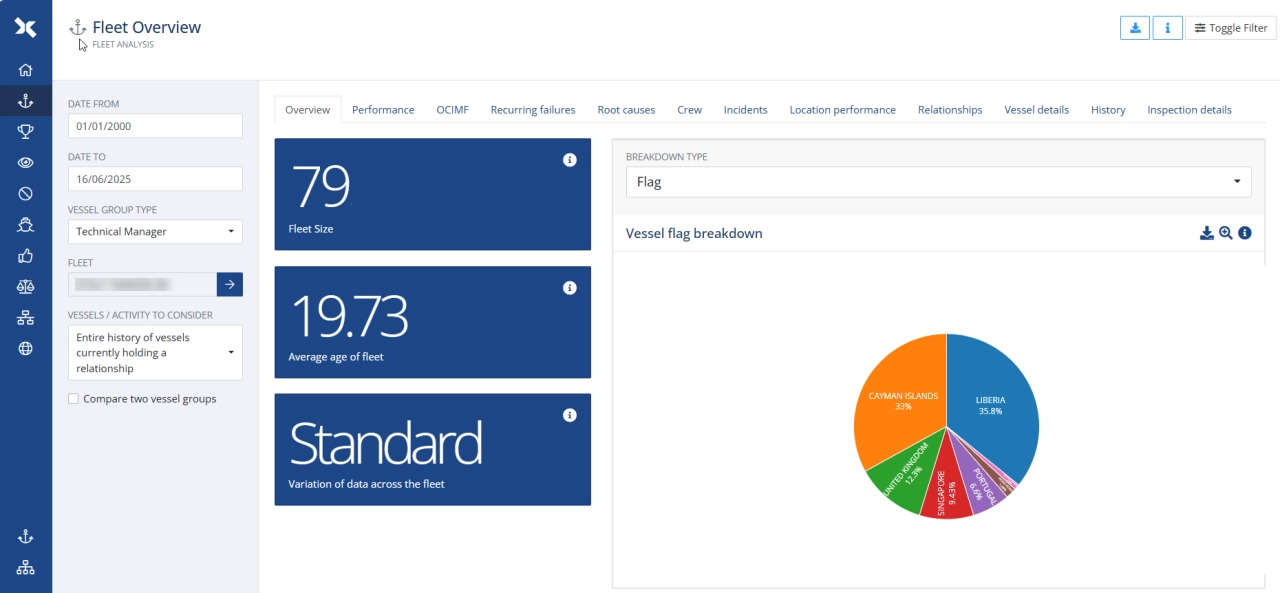
Marine BI’s Fleet Analysis module turns the global fleet into your benchmark. Start with a high-level snapshot of industry performance, then drill into any vessel group you define—by owner, class, flag, age, trade lane or risk profile—to uncover actionable insight.
With Fleet Analysis you can:
Gauge industry standing – see how your fleet stacks up against global averages for safety, compliance and operational KPIs.
Slice and dice the data – filter by vessel type, size, age or operator to zero-in on specific segments.
Spot leaders and laggards – highlight best-in-class performers and pinpoint vessels that need attention.
Track trend lines – monitor how key indicators shift over time, revealing emerging risks or opportunities.
Understand active relationships – examine every vessel currently linked to a selected organisation.
Gain a historical view – review all vessels ever associated with your company for a full-lifecycle perspective.
Inform strategy – use evidence-based comparisons to guide chartering choices, maintenance planning and policy updates.
Fleet Analysis lets you dive deep into performance drivers - across an entire fleet or down to a single hull- so you can spot strengths, uncover gaps and act with confidence.
Analyse any combination of factors, including:
Fleet / vessel performance – KPIs for safety, efficiency and compliance.
Inspection history – SIRE and PSC results, trends and outliers.
Recurring failures – repeat deficiencies that demand attention.
Berth compatibility – track suitability and turnaround outcomes by terminal.
Crew indicators – credentials, turnover and man-hour insights.
Incident records – frequency, severity and root-cause patterns.
Location-based performance – results by region, route or port call.
Relationship tenure – performance over the life of an owner, operator or manager relationship.
Vessel-specific details – age, class, flag, tech specs and more.
With granular benchmarking at your fingertips, you can set realistic targets, prioritise improvements and elevate operational standards fleet-wide.
Incident Analysis Likelihood
Incident Analysis
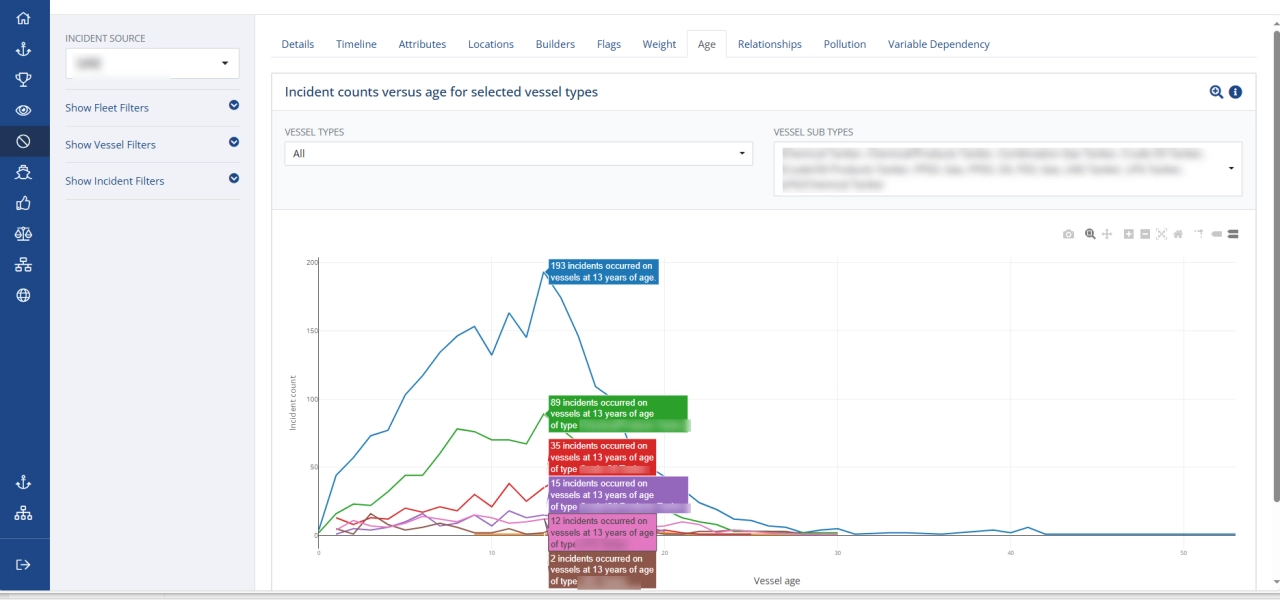
See exactly what happened, why it happened and how your vetting rules performed. Incident Analysis captures every key element - from event timeline and vessel details to post-incident outcomes - and flags any checks you could have added. The result is a clear view of process gaps and recurring patterns you can fix before they resurface.
Incident Likelihood
Look ahead with a data-driven projection of risk. Incident Likelihood calculates the probability of an incident on any vessel, or across entire fleets, over the next 12 months, then benchmarks that score against global norms. Compare fleets side-by-side to pinpoint where additional scrutiny will deliver the greatest return.
Why it matters
Validate and refine vetting rules by linking incidents to the checks that preceded them.
Spot systemic weaknesses with side-by-side fleet and company comparisons.
Prioritise resources toward vessels or partners with the highest projected risk.
Proactively mitigate incidents instead of reacting after the fact.
Together, Incident Analysis and Incident Likelihood give you the hindsight, insight and foresight to strengthen vetting practices and keep risk firmly under control.
Deep Learning & AI
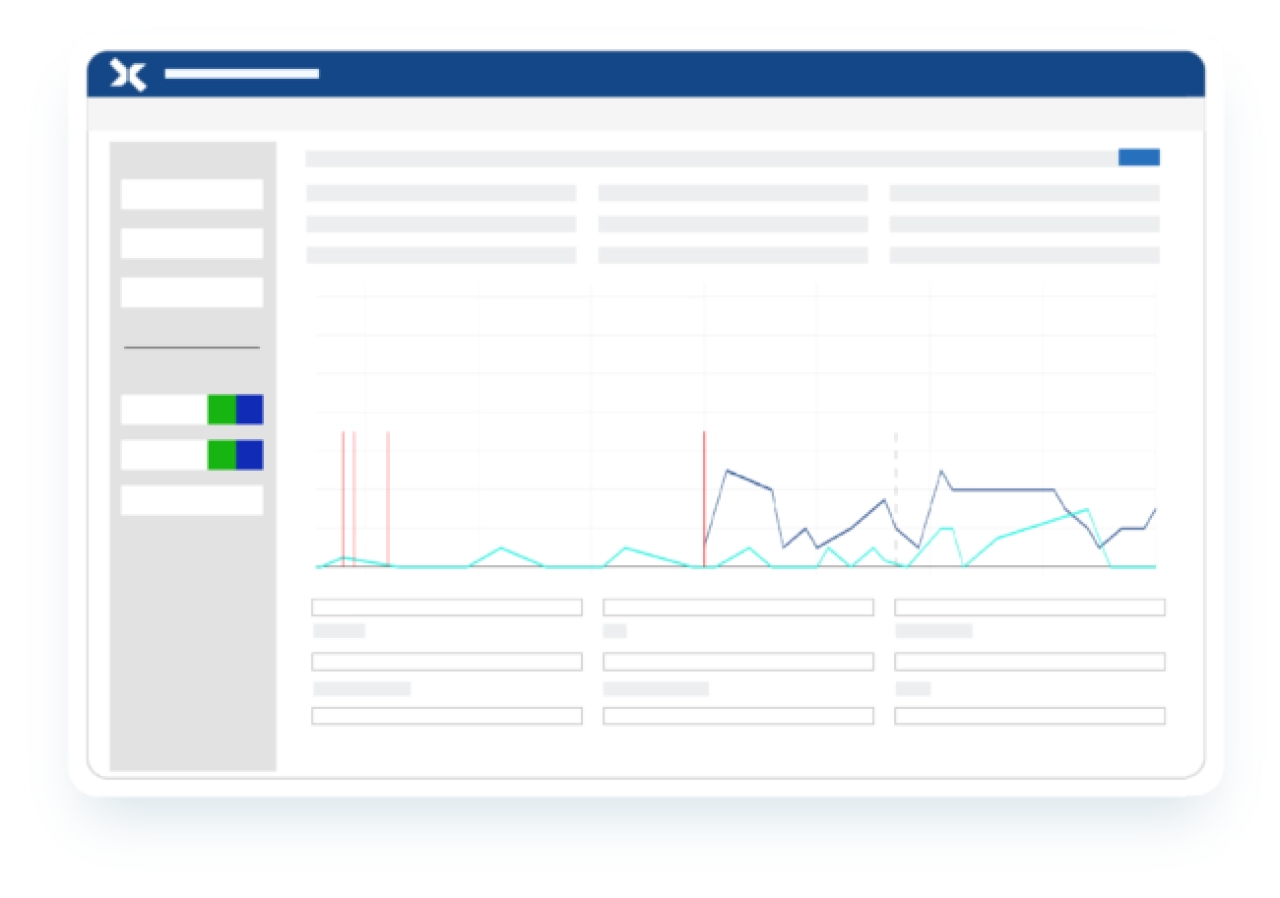
Marine BI brings deep learning and AI into marine assurance, crunching vast streams of vessel, company and incident data to forecast what could happen next. Sophisticated machine-learning models analyse live information against historical patterns, updating themselves continuously to predict the likelihood of an incident in the next 12 months.
The result is an always-evolving risk score that surfaces as it changes, so you can act early, allocate resources wisely and keep operations one step ahead of emerging threats.
Global Trending
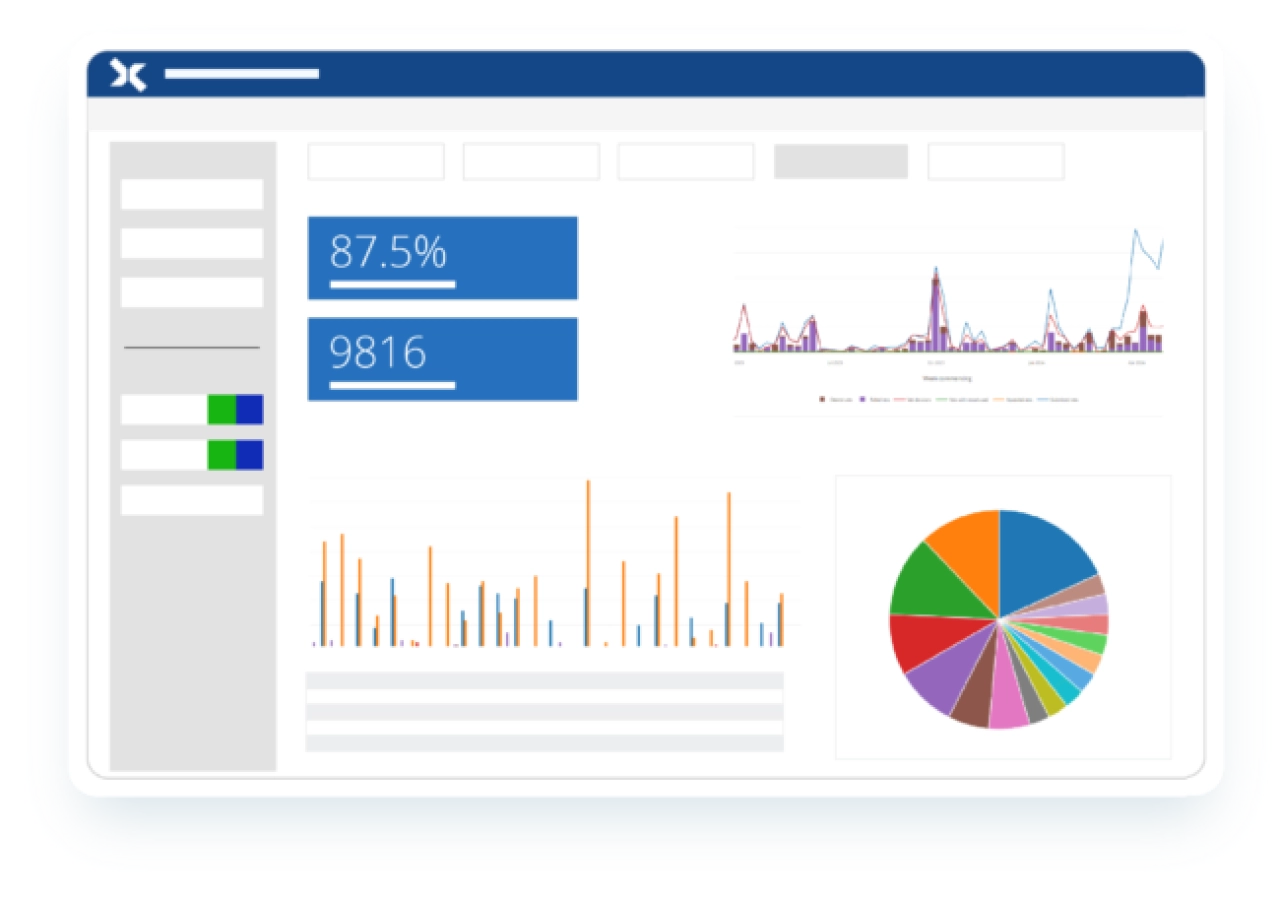
Industry-wide trend analysis has taken a leap forward, giving marine stakeholders clearer visibility of performance shifts over time. Marine BI brings that power to assurance. Its global-trending dashboards turn raw data into intuitive visuals and KPIs, so you can benchmark against the market, spot emerging patterns and set targets rooted in real numbers - not guesswork.
This big-picture perspective sharpens decision-making and keeps your organisation in step with - or ahead of - evolving industry standards.

Marine Assurance is constantly evolving. With the progress recently made in the fields of marine data and digital technology, the application of data science will provide the gateway to advancements in maritime risk assessment, safety and efficiency.
Dominic McKnight-Hardy
Managing Director, MIS Marine
Setting the standard for data-driven marine assurance
Actionable intelligence and flexible insight with an integrated system approach
Part of the comprehensive Mainstay assurance platform, Marine BI turns raw industry data into clear foresight, revealing trends and risks before they impact your operation.
Designed to slot seamlessly into your core vetting and compliance workflows, it combines live feeds, historical records and AI-powered analytics in a single, coordinated intelligence layer.
Because Marine BI is a fully integrated Mainstay module, every datapoint and prediction flows into one end-to-end view of marine risk, giving you the confidence to plan smarter, act sooner and stay ahead of the curve.
Vetting
Simplify the complexity of vetting across tankers, barges, offshore units and supporting companies with end-to-end voyage assurance across entire journeys, contracts or projects.
Mainstay Vetting
Compliance
Integrate seamlessly with leading global watchlists and data sources, giving you the latest visibility and early warning of sanctions risks.
Mainstay Compliance
Geolocalización
Combine AIS data with detailed insights on dark activity, STS events and monitored zones to deliver up-to-date visibility of location-based risks.
Mainstay Geolocalización
Marine Terminal Operations (MTO)
Enhance visibility, efficiency and control through integrated end-to-end terminal scheduling and cargo movement management.
Mainstay MTO
We’re excited to show you the incredible possibilities your data can offer.
To schedule a demo, discuss your data needs with us, or meet our data science team, complete our form.